This is just a short post with the R code for a stacked bar plot based on the msleep data set, which is part of the ggplot2 package.
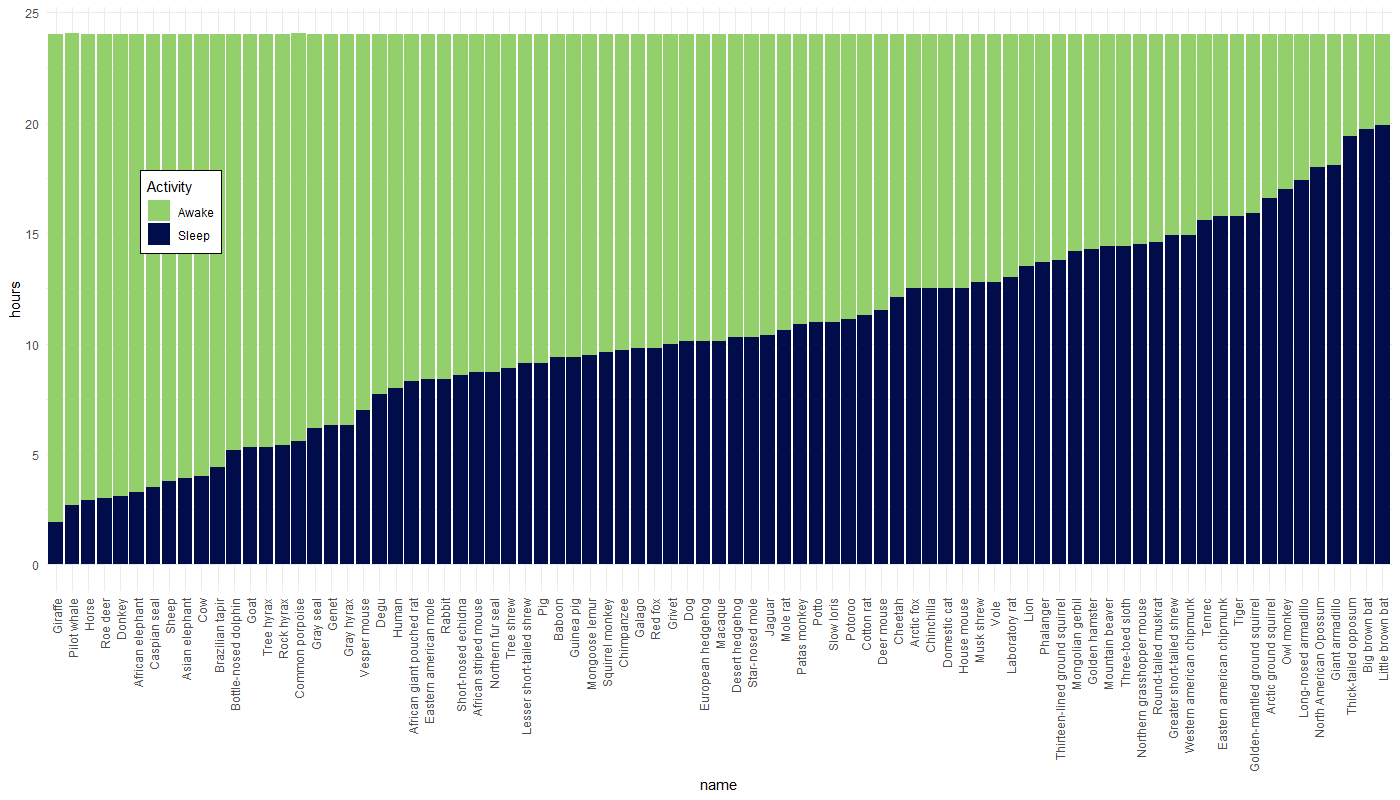
Bar plot from msleep data
Code highlighting test here:
# Load libraries
require(tidyverse)

# Load and check data
dat = msleep
dat
names(dat)

# Stacked bar plots using the ggplot2::msleep data

# Reorganize data first to longer data and only with required vars
dat = dat %>%
  mutate(name = fct_reorder(name, sleep_total)) %>% # Order by sleep length
  select(name, sleep_total, awake) %>%
  pivot_longer(cols = c('sleep_total', 'awake'),
               names_to = 'status',
               values_to = 'hours')

# Create plot
dat %>%
  ggplot(aes(x = name, y = hours, fill = status)) +
    geom_bar(stat = 'identity') +
    scale_fill_manual(values=c("#93cf6b", "#010c4a"),
                      labels = c('Awake', 'Sleep')) +
    labs(fill = 'Activity') +
    theme_minimal() +
    theme(
      axis.text.x = element_text(angle = 90, vjust = 0.5, hjust = 1),
      legend.position = c(0.1, 0.65),
      legend.background = element_rect(fill = "white"))
And here’s the resulting plot:
Gist for the code:
Python snippet
And a test code snippet using Python:
def say_hello():
    print("hello world!")

say_hello()   // "hello world!"
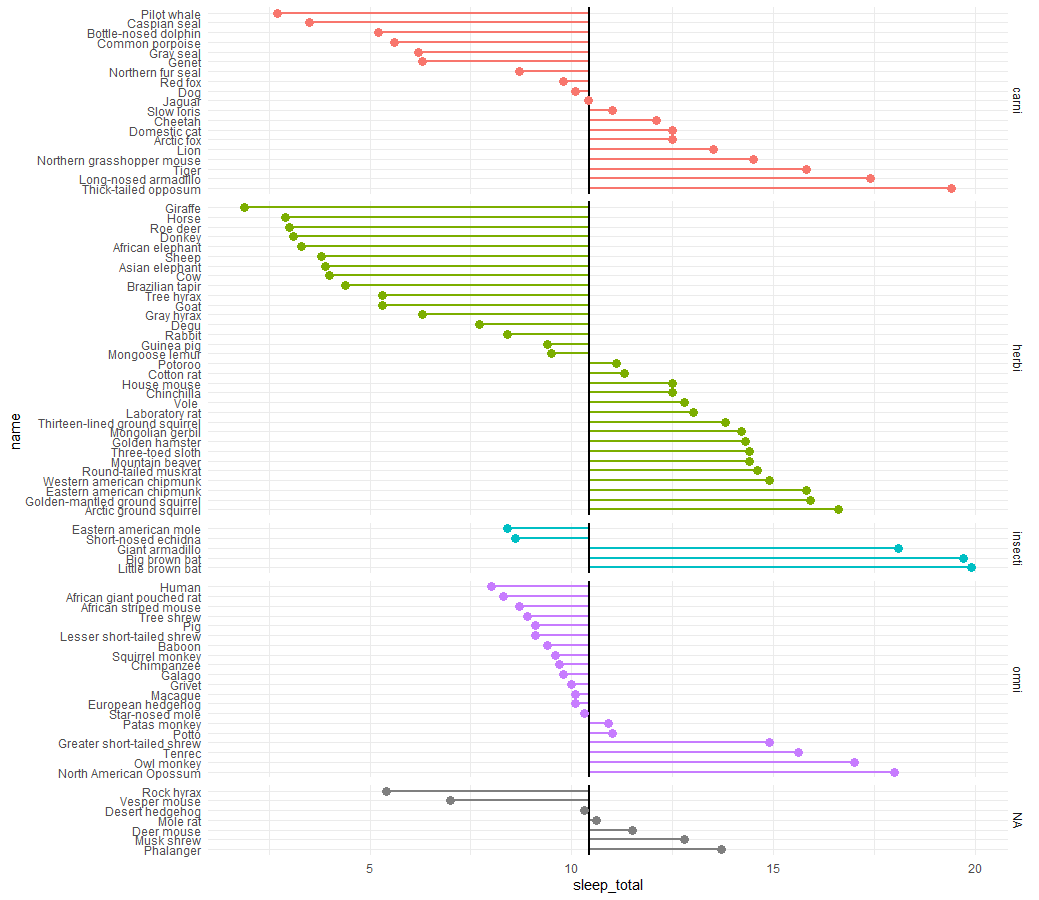
Alternative version with a ‘lollipop plot’